CFDs are complex instruments and come with a high risk of losing money rapidly due to leverage. 72.3% of retail investor accounts lose money when trading CFDs with this provider. You should consider whether you understand how CFDs work and whether you can afford to take the high risk of losing your money.
Friday Oct 24 2025 03:45

6 min

Beginner's guide to KDJ indicator: The KDJ indicator is a popular tool used by traders to understand market momentum and potential price reversals.
It builds upon the well-known KD indicator by adding an extra line to help smooth price movements and provide clearer signals. This guide walks through what the KD indicator is, how the KDJ is calculated, how to use it in trading, key strategies, and its advantages and disadvantages.
What Is the KD Indicator?
The KD indicator, also known as the Stochastic Oscillator, is a momentum indicator that compares a security's closing price to its price range over a specific period. It consists of two lines:
%K line: Reflects the current closing price relative to the highest and lowest prices over a set period.
%D line: A moving average of the %K line, smoothing out short-term fluctuations.
Traders use the KD indicator to identify overbought or oversold conditions, signaling when prices may reverse.
The KDJ indicator adds a third line, called the J line, which amplifies the differences between %K and %D, providing potentially earlier signals.
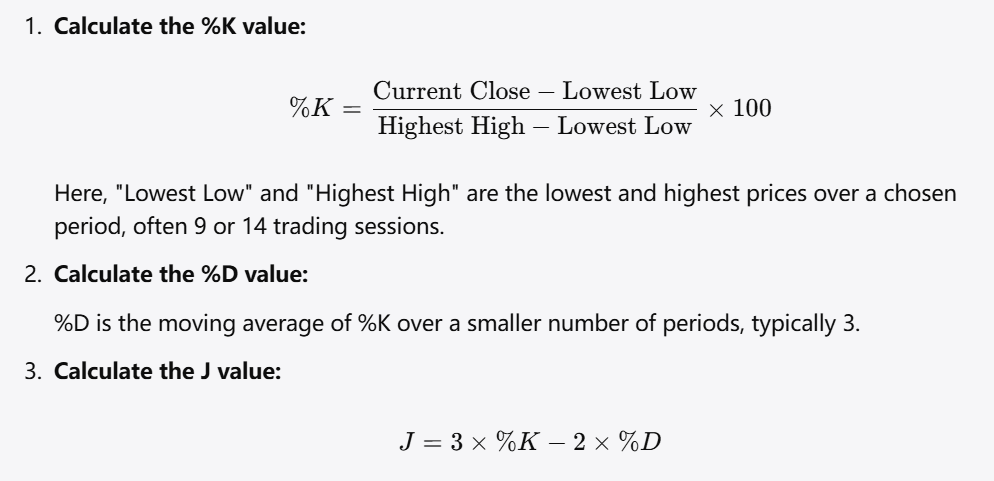
How to Calculate the KD Indicator?
The KD indicator calculation involves the following steps:

How to Use the KD Indicator?
The KD indicator is primarily used to spot potential price reversals and momentum shifts. When prices are moving upwards or downwards, the %K and %D lines help identify whether the asset is overextended.
Overbought Region: When the lines are near the upper bound (usually above 80), the asset may be overbought.
Oversold Region: When the lines are near the lower bound (usually below 20), the asset may be oversold.
Crossovers between the %K and %D lines are also important signals:
Bullish Crossover: When %K crosses above %D, it can indicate upward momentum.
Bearish Crossover: When %K crosses below %D, it can indicate downward momentum.
The J line in the KDJ indicator provides earlier signals but can be more volatile.
KD Indicator Trading Strategies
1. KD Indicator Overbought/Oversold (OB/OS)
This strategy focuses on identifying when an asset is overbought or oversold:
Overbought Signal: When the %K and %D lines rise above the upper threshold and then cross downward, it may suggest a price decline is coming.
Oversold Signal: When the lines fall below the lower threshold and then cross upward, it may suggest a potential price increase.
Traders often wait for confirmation such as price action or volume changes before acting solely on these signals.

2. KD Indicator Divergence
Divergence occurs when the price moves in one direction, but the KD lines move in the opposite direction. This can signal a weakening trend and a possible reversal.
Bullish Divergence: Price forms lower lows, but the KD indicator forms higher lows, indicating decreasing downward momentum.
Bearish Divergence: Price forms higher highs, but the KD indicator forms lower highs, suggesting weakening upward momentum.
Divergence can provide early warnings of trend changes, but it should be combined with other indicators or confirmation methods.
Is the KD Indicator Enough?
Relying solely on the KD or KDJ indicator may not be sufficient for consistent trading decisions. While it offers valuable insights into momentum and potential turning points, market conditions can lead to false signals, especially in highly volatile or trending markets.
Combining the KD indicator with other tools such as volume analysis, trend indicators, or support and resistance levels can improve clarity and reduce the risk of misleading signals. Using risk management strategies, including stop-loss orders, is also advisable.
KD Indicator Pros and Cons

Pros
Simple to Understand: The calculation and interpretation are straightforward, making it beginner-friendly.
Effective in Range-Bound Markets: It performs well when markets move sideways, helping identify overbought and oversold conditions.
Early Signals: The J line in the KDJ version provides earlier alerts to potential momentum changes.
Versatile: Can be applied to various markets including stocks, forex, and cryptocurrencies.
Cons
False Signals in Trending Markets: The indicator can give misleading signals during strong uptrends or downtrends.
Volatility of the J Line: The J line can be overly sensitive, resulting in frequent whipsaws.
Lagging Nature: Despite early signals, the indicator still relies on historical price data and may lag actual market movements.
Needs Confirmation: Should be used alongside other indicators or methods to improve reliability.
Conclusion
The KD and KDJ indicators are valuable tools to gauge momentum and spot potential reversals within the market. Their simplicity and versatility make them popular among traders across different asset classes. However, understanding their limitations is essential—especially their tendency to produce false signals in trending markets and the volatility of the J line.
Using the KD indicator in combination with other trading tools and proper risk management can enhance decision-making. For beginners, starting with the basics of the KD indicator and gradually incorporating the J line and divergence strategies can build a solid foundation for more advanced trading approaches.
Risk Warning: this article represents only the author’s views and is for reference only. It does not constitute investment advice or financial guidance, nor does it represent the stance of the Markets.com platform.When considering shares, indices, forex (foreign exchange) and commodities for trading and price predictions, remember that trading CFDs involves a significant degree of risk and could result in capital loss.Past performance is not indicative of any future results. This information is provided for informative purposes only and should not be construed to be investment advice. Trading cryptocurrency CFDs and spread bets is restricted for all UK retail clients.