星期二 五月 13 2025 08:03

5 最小

Global stock markets rallied on Monday after the United States and China reached an agreement to significantly reduce steep tariffs for at least 90 days, easing tensions in a prolonged trade war between the world’s two largest economies. The deal temporarily halted a conflict that had fuelled fears of a global recession and disrupted nearly $600 billion in two-way trade. According to both parties, the U.S. will lower its additional tariffs on Chinese goods from 145% to 30%, while China will reduce its tariffs on American imports from 125% to 10% over the same period.
Despite the positive market reaction, the temporary truce does little to resolve the deeper issues that sparked the trade dispute. Structural tensions remain, particularly around the U.S. trade deficit with China and Washington's demand for stronger action from Beijing to combat the U.S. fentanyl crisis. While the tariff rollback provides short-term relief, long-term stability in U.S.–China economic relations will likely depend on addressing these core disagreements in future negotiations.

(S&P 500 Index Daily Chart, Source: Trading View)
From a technical analysis perspective, the S&P 500 index has been in a bullish trend since the beginning of April 2025, as indicated by a series of higher highs and higher lows. Currently, it is retesting the resistance zone between 5,800 and 5,850. If it breaks above this zone, the index may potentially move higher to retest the order block between 6,100 and 6,140. Conversely, if bearish pressure prevents a breakout, it might push the index lower to retest the swap zone between 5,500 and 5,540.
The U.S. month-over-month (MoM) inflation rate for March was -0.1%, while the April forecast is +0.3%. On a year-over-year (YoY) basis, inflation was 2.4% in March, with April’s estimate slightly higher at 2.5%. This expected increase is likely due to a combination of base effects, where April 2024 had relatively muted inflation, making annual comparisons appear higher, and a potential rebound in volatile categories like energy prices, which may have dragged March’s figure lower.
Additionally, inflation in sticky components such as shelter and services remains elevated and may have continued rising in April. Strong consumer demand and a resilient labour market could also be contributing factors, giving businesses more pricing power. Altogether, these elements support the forecasted rebound in both monthly and annual inflation figures. This data is set to be released today at 12:30 GMT.

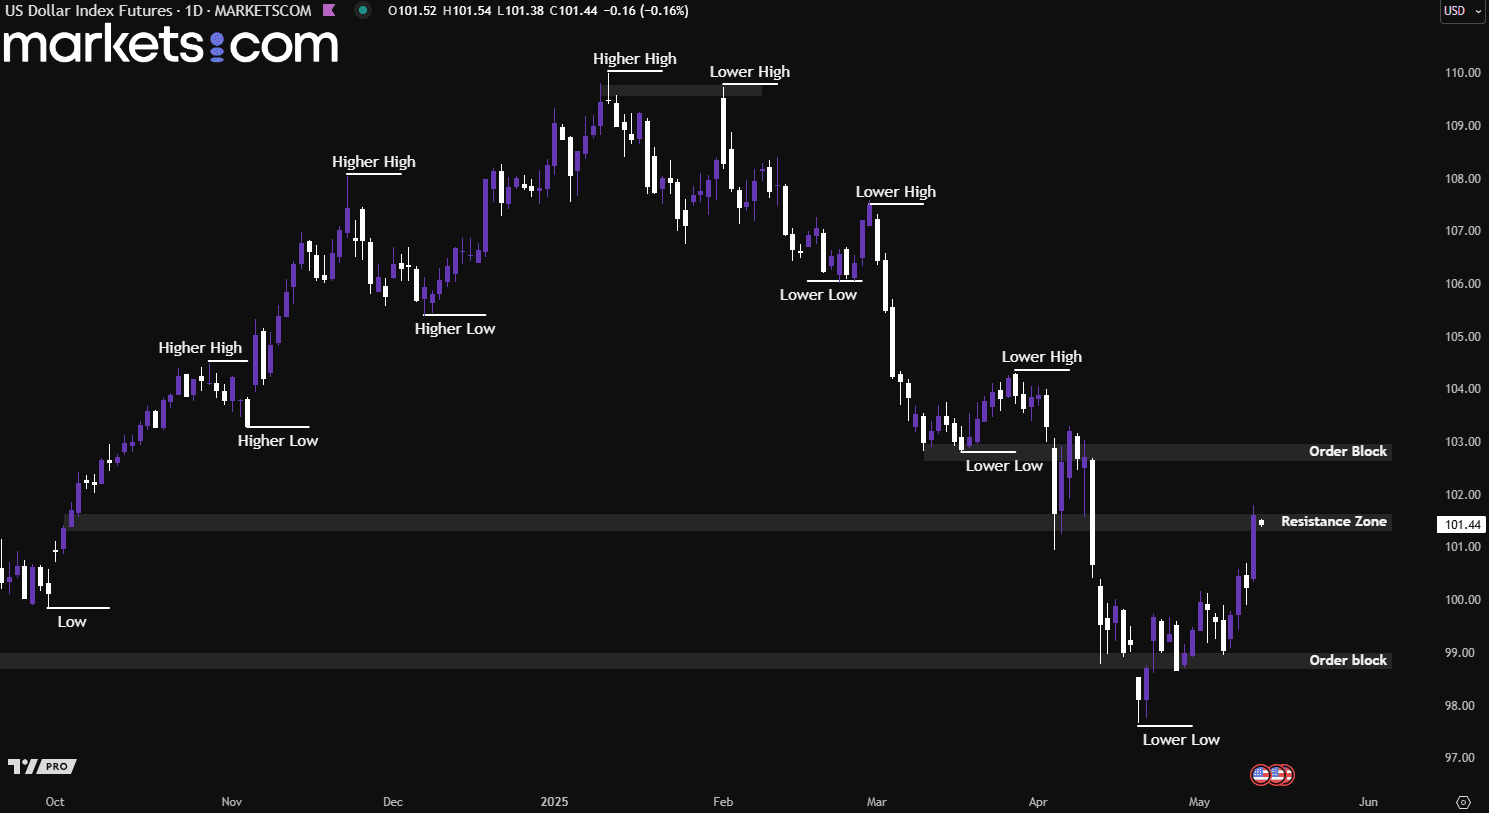
(U.S Dollar Index Daily Chart, Source; Trading View)
From a technical analysis perspective, by focusing on nearer price action first, the U.S dollar has been moving in a bullish trend since 21 April 2025, as indicated by the higher highs and higher lows. Currently, it is retesting the resistance zone of 101.30 – 101.60. If it can break above this resistance
zone, it may potentially move higher to retest the order block of 102.65 – 103.95. Furthermore, a breakout above the order block would indicate that the overall trend on the higher timeframe may be shifting from bearish to bullish.
Bank of England Governor Andrew Bailey is scheduled to speak today at 15:00 GMT, and markets will be closely monitoring his remarks for insights into the central bank's monetary policy direction. Following the recent 25 basis point rate cut to 4.25%, Bailey is expected to reaffirm the BoE's commitment to its 2% inflation target, emphasising a cautious and data-driven approach to future rate adjustments. He may highlight the ongoing disinflation in domestic prices and wage pressures, while acknowledging the need to monitor second-round effects and the impact of global economic uncertainties, such as trade disruptions and tariffs.
Additionally, Bailey might discuss the BoE's adoption of scenario-based forecasting to better navigate the complexities of the current economic landscape, characterised by unpredictable shocks and structural challenges. This approach allows the central bank to assess a range of potential outcomes and enhances its ability to respond to unforeseen events.

(GBP/USD Daily Chart, Source: Trading View)
From a technical analysis perspective, the GBP/USD currency pair has been moving in a bullish trend since mid of January 2025, as indicated by the higher highs and higher lows. However, recently, it has been rejected from the resistance zone of 1.3380 – 1.3420, driving the pair lower, breaking below the swap zone of 1.3220 – 1.3260. This valid bearish breakout structure suggests that the pair may continue to decline, potentially retesting the support zone between 1.2710 and 1.2750.
When considering shares, indices, forex (foreign exchange) and commodities for trading and price predictions, remember that trading CFDs involves a significant degree of risk and could result in capital loss.
Past performance is not indicative of any future results. This information is provided for informative purposes only and should not be construed to be investment advice.