You are attempting to access a website operated by an entity not regulated in the EU. Products and services on this website do not comply with EU laws or ESMA investor-protection standards.
As an EU resident, you cannot proceed to the offshore website.
Please continue on the EU-regulated website to ensure full regulatory protection.
திங்கள் Jun 9 2025 08:21

5 நிமி

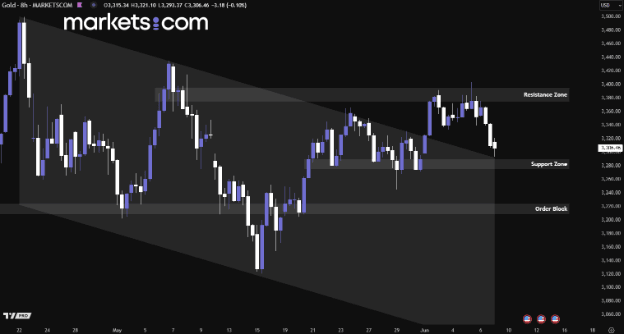
Gold prices slipped to around $3,295 per ounce on Monday during the Asian trading session at the time of writing, marking a third straight session of decline and the lowest level in a week. The drop comes as investors turn their focus to the upcoming U.S.-China trade talks. Additional downward pressure stemmed from a stronger-than-expected U.S. jobs report released on last Friday, which tempered recession fears and reduced expectations for near-term Federal Reserve rate cuts. According to the U.S. Bureau of Labor Statistics, 139,000 jobs were added in May, down from April’s 147,000 but still above the forecast of 125,000.
Despite recent losses, gold may find support from rising geopolitical tensions. Russia launched a large-scale drone and missile assault on Kyiv and other Ukrainian regions early Friday, just days after Ukraine's surprise strike on Russian air bases. These developments may bolster safe-haven demand, potentially limiting further downside for the gold.

(Gold Daily Price Chart, Source: Trading View)
From a technical analysis perspective, gold was recently rejected from the resistance zone between 3,375 and 3,395, pushing the price lower and bringing it closer to the support zone at 3,275 – 3,289, as well as the upper boundary of the descending channel. If gold manages to find support in this area, it may regain bullish momentum and surge upward, potentially retesting the 3,375 – 3,395 resistance zone. Conversely, if bearish pressure is too strong and drives the price to break below the support zone, it could potentially fall further to retest the order block between 3,210 and 3,225.
Pivotal U.S.-China trade talks are set to take place in London later today, coming at a critical juncture for both economies. China is contending with deflationary pressures, while trade uncertainty continues to weigh on U.S. consumer and business sentiment. As a result, investors are beginning to question the dollar's status as a safe-haven asset amid global economic unease.
The U.S. delegation is expected to include Treasury Secretary Scott Bessent, Commerce Secretary Howard Lutnick, and Trade Representative Jamieson Greer. On the Chinese side, Vice Premier He Lifeng is likely to attend. While a commitment to continue negotiations may offer a symbolic win, the absence of a concrete breakthrough would likely leave market sentiment subdued.

(GBP/USD Daily Chart, Source: Trading View)
From a technical analysis perspective, the GBP/USD currency pair has been trending upward since mid-January 2025, as indicated by a pattern of higher highs and higher lows. Recently, it broke above the key resistance zone of 1.3380–1.3420, signaling that bullish momentum remains strong. The pair is currently facing resistance from the order block between 1.3575 and 1.3595. If it manages to break above this level, it may potentially continue to surge higher.
China’s producer deflation worsened in May, reaching its deepest level in nearly two years, while consumer prices continued to decline. Data from the National Bureau of Statistics showed that the producer price index (PPI) dropped 3.3% year-over-year, a sharper fall than April’s 2.7% decline and the steepest contraction in 22 months. The ongoing slide reflects persistent economic headwinds, including prolonged housing market weakness and trade tensions. In response to cautious consumer spending driven by income pressures, some firms have resorted to price cuts to stimulate sales, prompting authorities to call for an end to aggressive price wars in sectors like the auto industry.
Despite recent policy support, weak domestic demand continues to weigh on China's economic recovery. While headline inflation remains subdued, core inflation, which excludes volatile food and energy prices rose 0.6% year-on-year in May, slightly higher than the 0.5% increase in April. The modest uptick in core inflation offers limited relief, underscoring the challenges policymakers face in reviving confidence and demand.

(USD/CNH Daily Chart, Source: Trading View)
From a technical analysis perspective, the USD/CNH currency pair has been trending downward since the beginning of April 2025, as evidenced by a series of lower highs and lower lows. Recently, it has retested the swap zone between 7.2160 and 7.2260 multiple times but was rejected by sustained bearish pressure, failing to break above. This continued bearish momentum could potentially push the pair lower to retest the support zone between 7.1350 and 7.1450.
Risk Warning and Disclaimer: This article represents only the author’s views and is for reference only. It does not constitute investment advice or financial guidance, nor does it represent the stance of the Markets.com platform. Trading Contracts for Difference (CFDs) involves high leverage and significant risks. Before making any trading decisions, we recommend consulting a professional financial advisor to assess your financial situation and risk tolerance. Any trading decisions based on this article are at your own risk.