

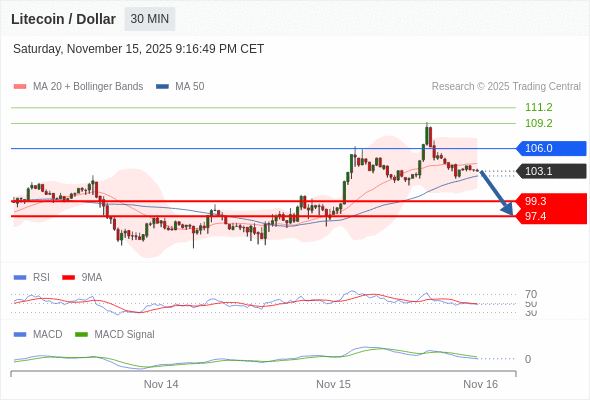
Our preference: target 97.4.

Commodity market today: Gold continues to capture attention as a key commodity within global markets. Its price movements often reflect broader economic trends, geopolitical tensions.

AI stocks are trending: The burgeoning artificial intelligence (AI) sector has drawn considerable attention, with several prominent companies leading the charge.

VOO performance analysis: The Vanguard S&P 500 ETF, commonly known as VOO, is one of the most popular exchange-traded funds tracking the performance of the S&P 500 index.

Easy stocks for beginners: Investing in the stock market can be intimidating for beginners, choosing the right stocks to start with is crucial.

Stellar climbs 4% today: Stellar (XLM) has recently experienced a noticeable upward movement, drawing attention to its potential trajectory in the coming years.
A detailed study of stablecoin depegging incidents, from algorithmic models to traditional banking impacts, extracting crucial lessons to avoid future risks.
Will Peck of WisdomTree anticipates a significant rise in popularity for diversified crypto ETFs, offering investors a simpler route to accessing the digital asset market and mitigating risks associated with individual token investments.
Aztec is set to launch a major token sale, integrating Uniswap's CCA mechanism for fair price discovery. This article provides an in-depth analysis of the sale process, token distribution, and governance potential.

Which broker is best for bitcoin trading: The cheapest option often depends on your trading volume, frequency, and whether you want to own the underlying asset or simply speculate on its price.

Crypto day trading strategy: Cryptocurrency day trading has become increasingly popular as digital assets continue to gain mainstream attention and adoption.

Commodity trading strategy: West Texas Intermediate (WTI) crude oil has long been a central commodity in global energy markets.


