This Nasdaq forecast analyses cooler US PPI, Fed expectations, earnings risks and key NDX support and resistance levels shaping the near-term outlook.

This AMD stock price forecast examines AI server growth, Venice and Helios catalysts, valuation risks, technical levels and key investor scenarios for 2026.

During the week commencing the 13th of July, market participants will an economic calendar, which is slightly on the lighter side. But probably, the main focus might fall on the US June inflation numbers, where the headline YoY figure is expected to ease a bit, from 4.2%, to 3.9%. The Bank of Canada might be hitting the spotlight, as the Bank will be deciding on their rate. At the time of writing there is no available forecast for the rate, we believe that the Committee will keep the rate unchanged, at least for now.
USD/CAD forecast covers the rebound from 1.4135, resistance at 1.4190 and how Canada’s June employment report could shape the pair’s next move in forex markets.
Read our comprehensive XRP price forecast for 2026, 2027, and 2030. Discover key market drivers, future projections, and how to start CFD trading on XRP.

Read our objective Markets.com review for 2026. Explore its 500+ CFDs, 0.0-pip spreads, MT4/MT5 support, and regulatory safety to see if it is the best CFD trading platform for you.
Compare the best Interactive Brokers Alternatives in 2026. Discover top brokers based on fees, usability, trading platforms, features, and market access.

Looking for the best eToro alternatives in 2026? Compare top brokers like Markets.com, IBKR, and IC Markets to unlock lower spreads, raw ECN execution, and advanced charting tools.

Learn how order blocks in forex work, how to identify bullish and bearish zones, and how market structure and risk controls apply to CFD trading for beginners.
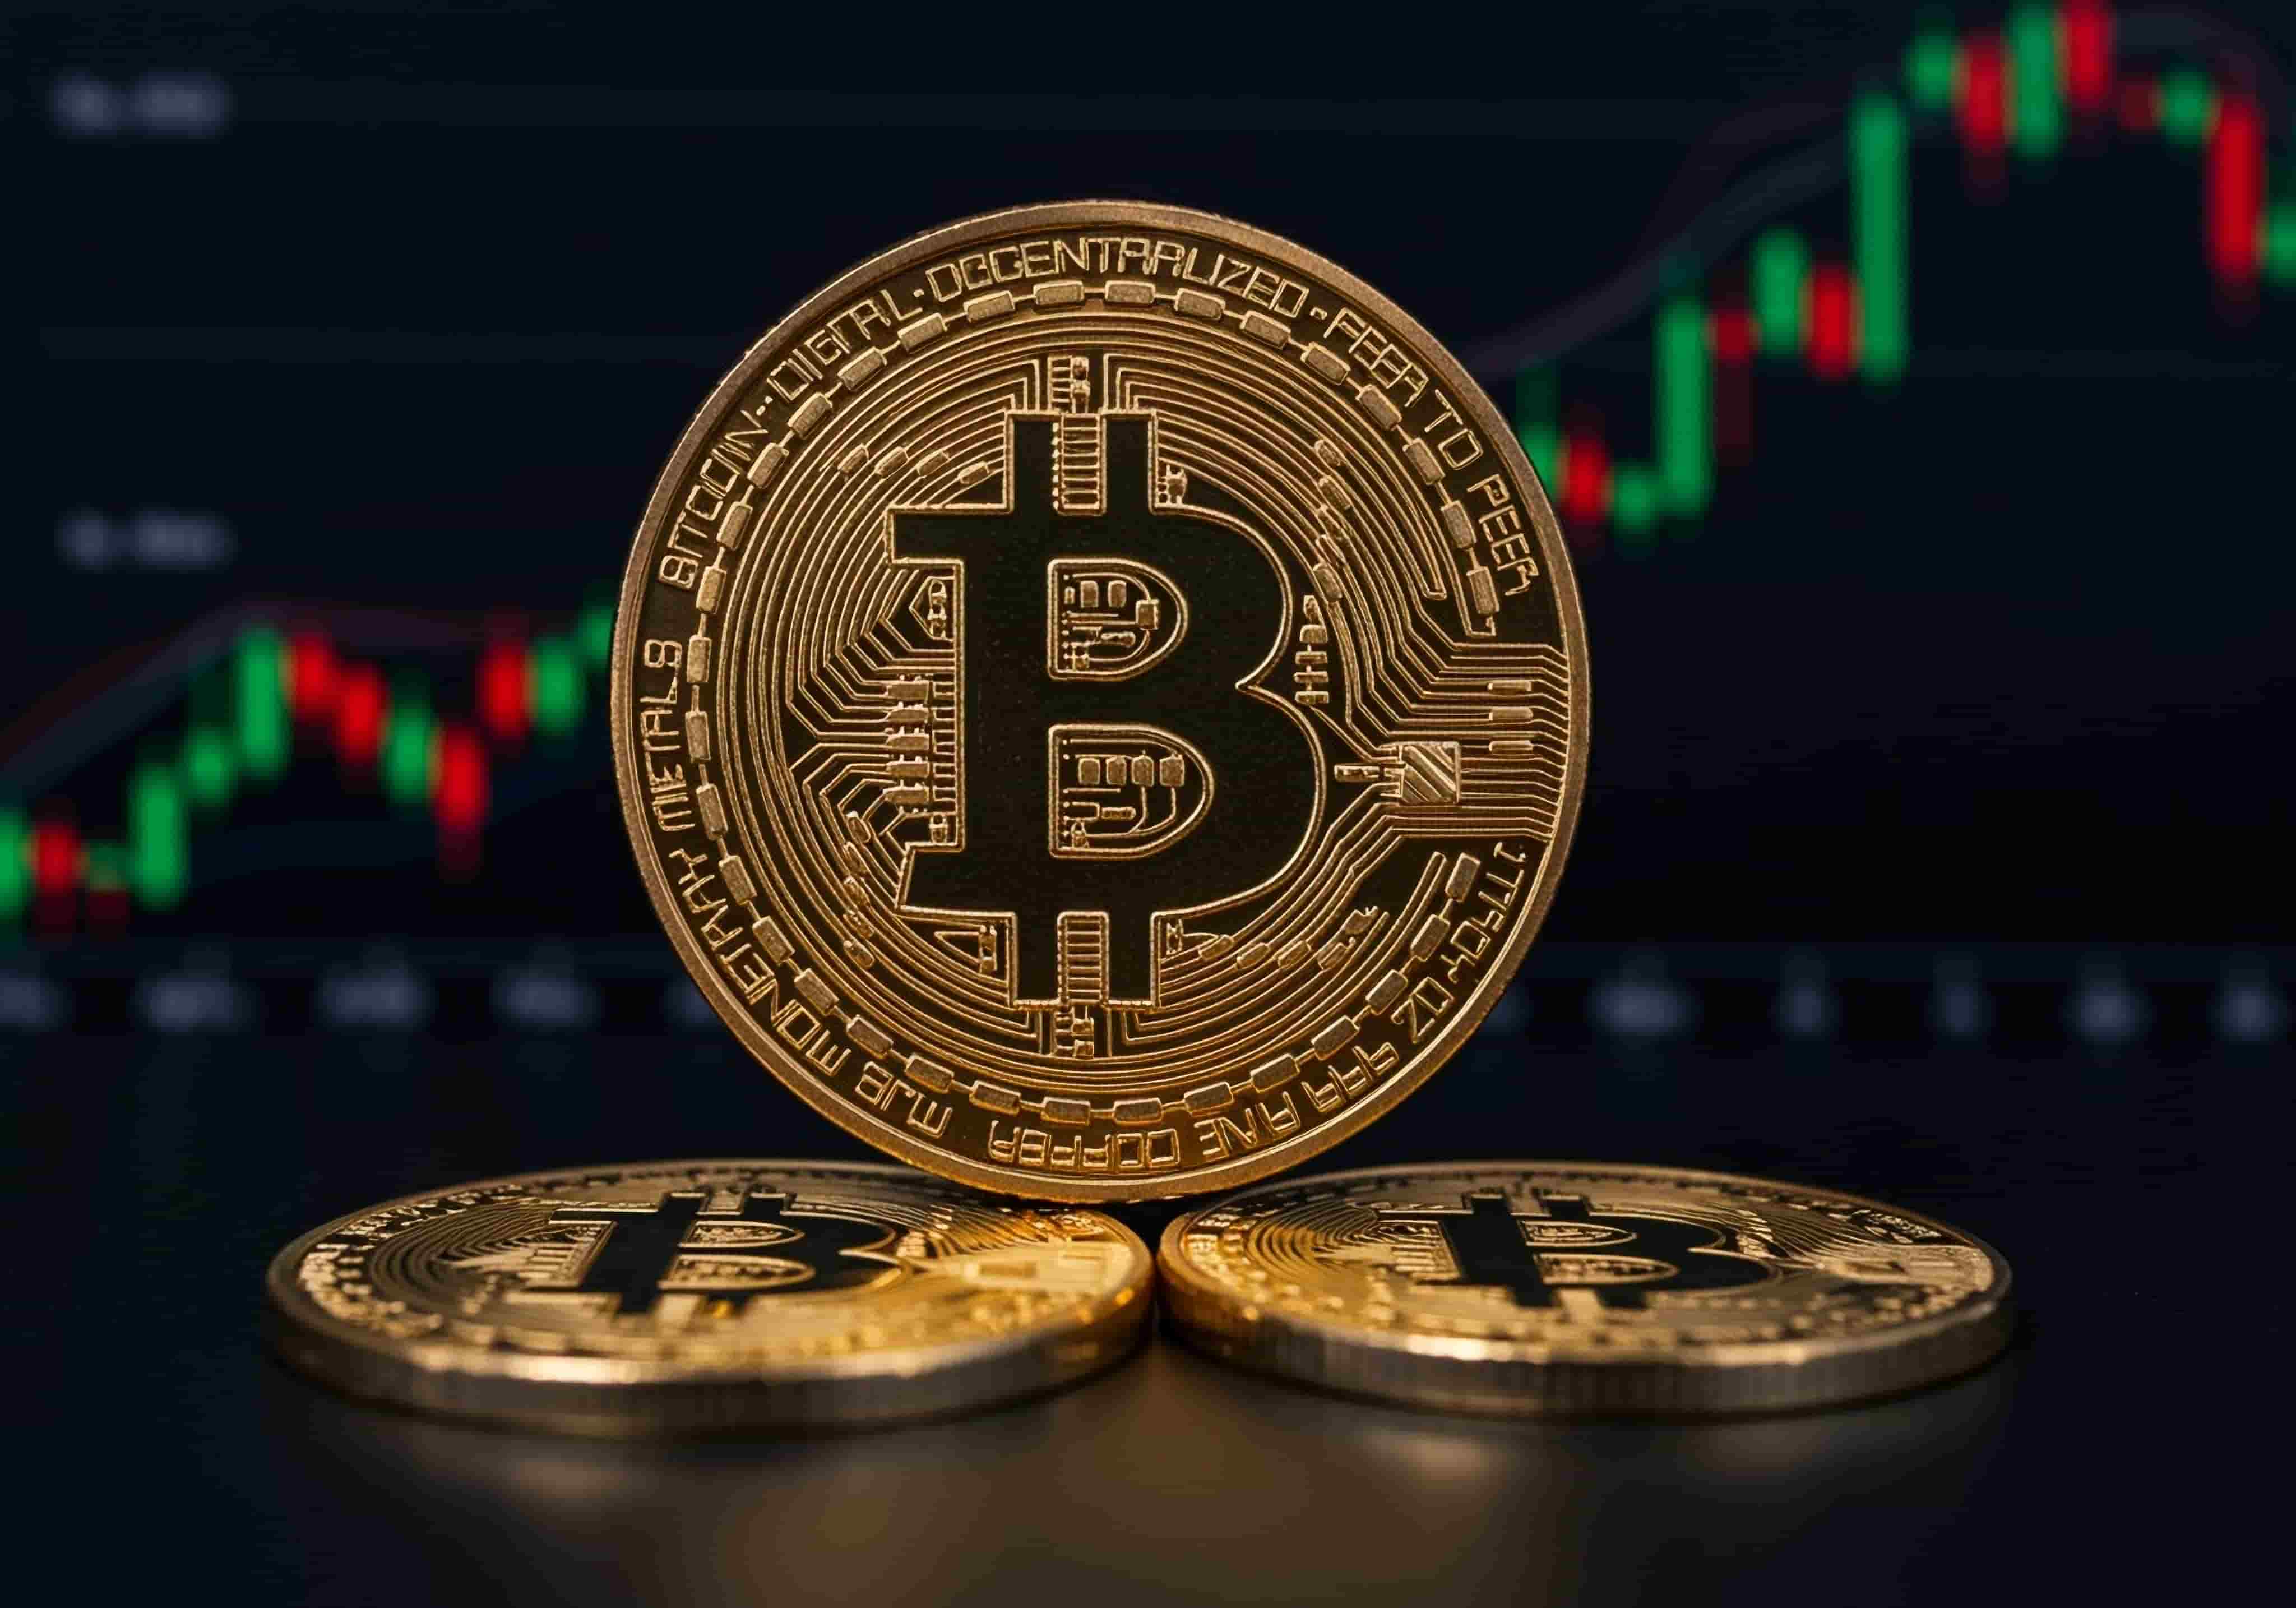
Bitcoin price today is $63,485.49, down 0.55% in the past 24 hours. Discover what's driving BTC, the latest crypto market news, and key levels investors should watch.
USD to JPY exchange rate today: Check the latest USD/JPY rate, why the Japanese yen is strengthening, key market news, and the forex outlook.

Check the gold price today as spot gold drops below $4,000 per ounce on July 17. Rising US Treasury yields and resilient retail sales pressure the metal.

What is a stock index? It's a single number that tracks a group of shares. Learn how indices work, how they're calculated, and the major world indices.
When can you trade indices? See index trading hours for US30, NAS100, Germany 40 and more — every session converted to UAE Gulf Standard Time (GST).

Compare the main index trading strategies for 2026 — trend-following, breakout, range, and news trading — and learn how to match one to your style and schedule.