You are attempting to access a website operated by an entity not regulated in the EU. Products and services on this website do not comply with EU laws or ESMA investor-protection standards.
As an EU resident, you cannot proceed to the offshore website.
Please continue on the EU-regulated website to ensure full regulatory protection.
Rabu Aug 6 2025 07:20

5 min.

The United States and the European Union reached a framework trade agreement on Sunday, avoiding a major trade conflict by settling on a 15% import tariff on most EU goods, half the initially threatened rate. The agreement, announced by U.S. President Donald Trump and European Commission President Ursula von der Leyen after a one-hour meeting at Trump’s golf course in western Scotland, follows months of intense negotiations. Both leaders framed the deal as a significant achievement, with von der Leyen calling it “the best we could get,” and acknowledging Trump as a tough negotiator.
Trump hailed the deal as the biggest ever, highlighting the EU's plans to invest around $600 billion in the U.S. and significantly ramp up imports of American energy and military goods. The agreement comes just a week after a $550 billion trade pact with Japan, further strengthening U.S. trade ties. Trump emphasised that the deal would restore fairness to transatlantic trade and deepen economic cooperation after years of what he described as one-sided treatment of U.S. exporters.

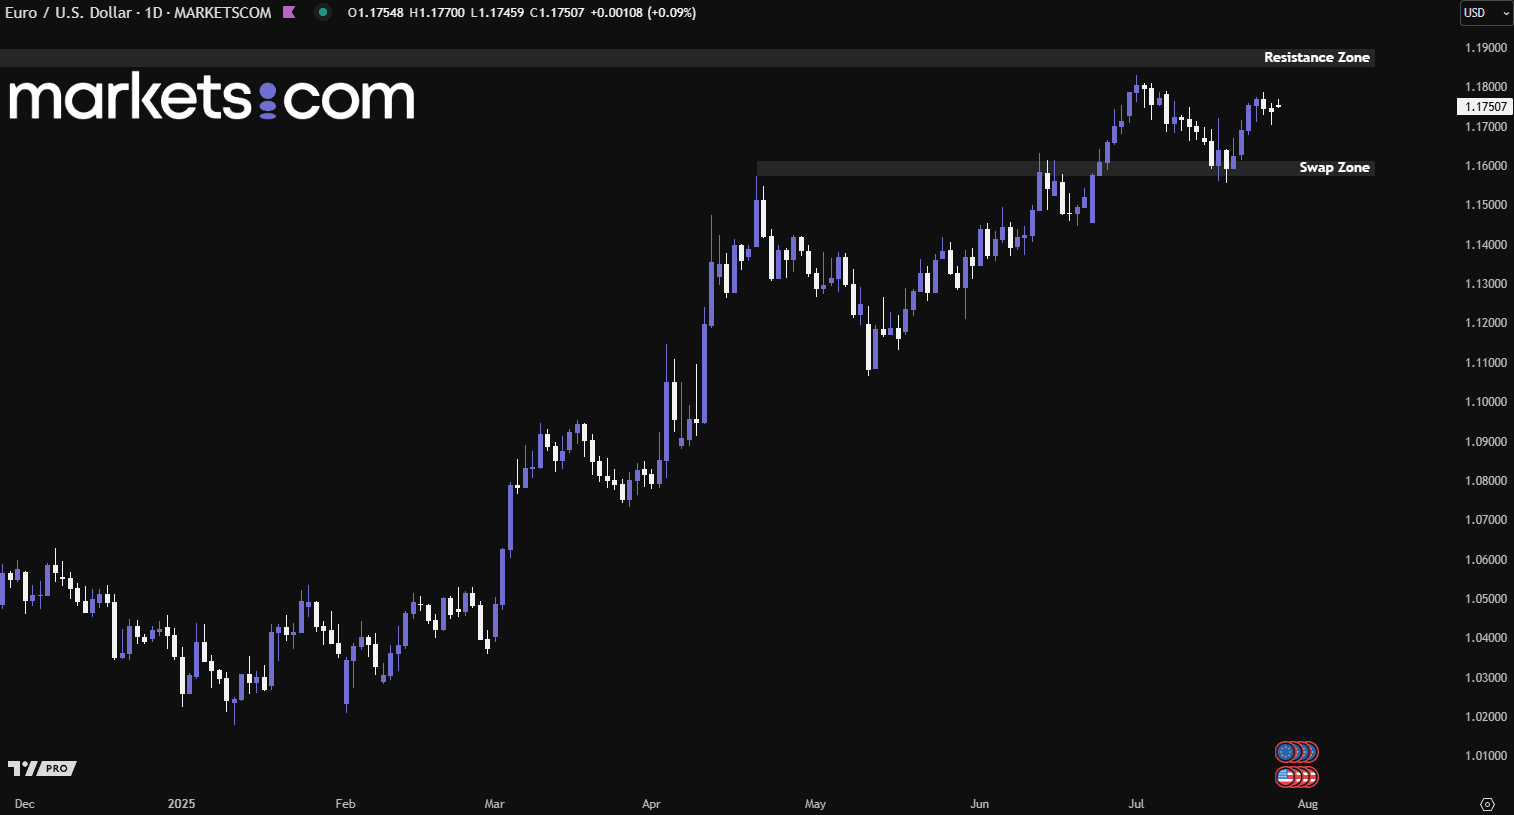
(EUR/USD Daily Chart, Source: Trading View)
From a technical analysis perspective, the EUR/USD currency pair has been in a bullish trend since mid-January 2025, as indicated by the formation of higher highs and higher lows. Recently, the pair broke above the swap zone of 1.1570 – 1.1610, pulled back to retest the area, found support, and continued to surge upward. This valid bullish structure may potentially drive the pair further up to retest the resistance zone at 1.1850 – 1.1900.
A long-dormant Bitcoin whale from the early 2010s, often referred to as a "Satoshi-era" investor, has resurfaced, selling 80,000 BTC worth approximately $9 billion. The transaction, executed by Galaxy Digital, marks one of the largest single Bitcoin moves in recent history. These coins were either mined or acquired during Bitcoin's infancy, making the sale a notable event within the crypto community.
Despite the size of the liquidation, Bitcoin has shown remarkable resilience. The market absorbed the $9 billion sell-off with only limited volatility, and prices have since stabilised. This strong recovery has boosted bullish sentiment, with many investors viewing the market’s ability to withstand such selling pressure as a sign of maturing strength and upward potential in Bitcoin’s trajectory.

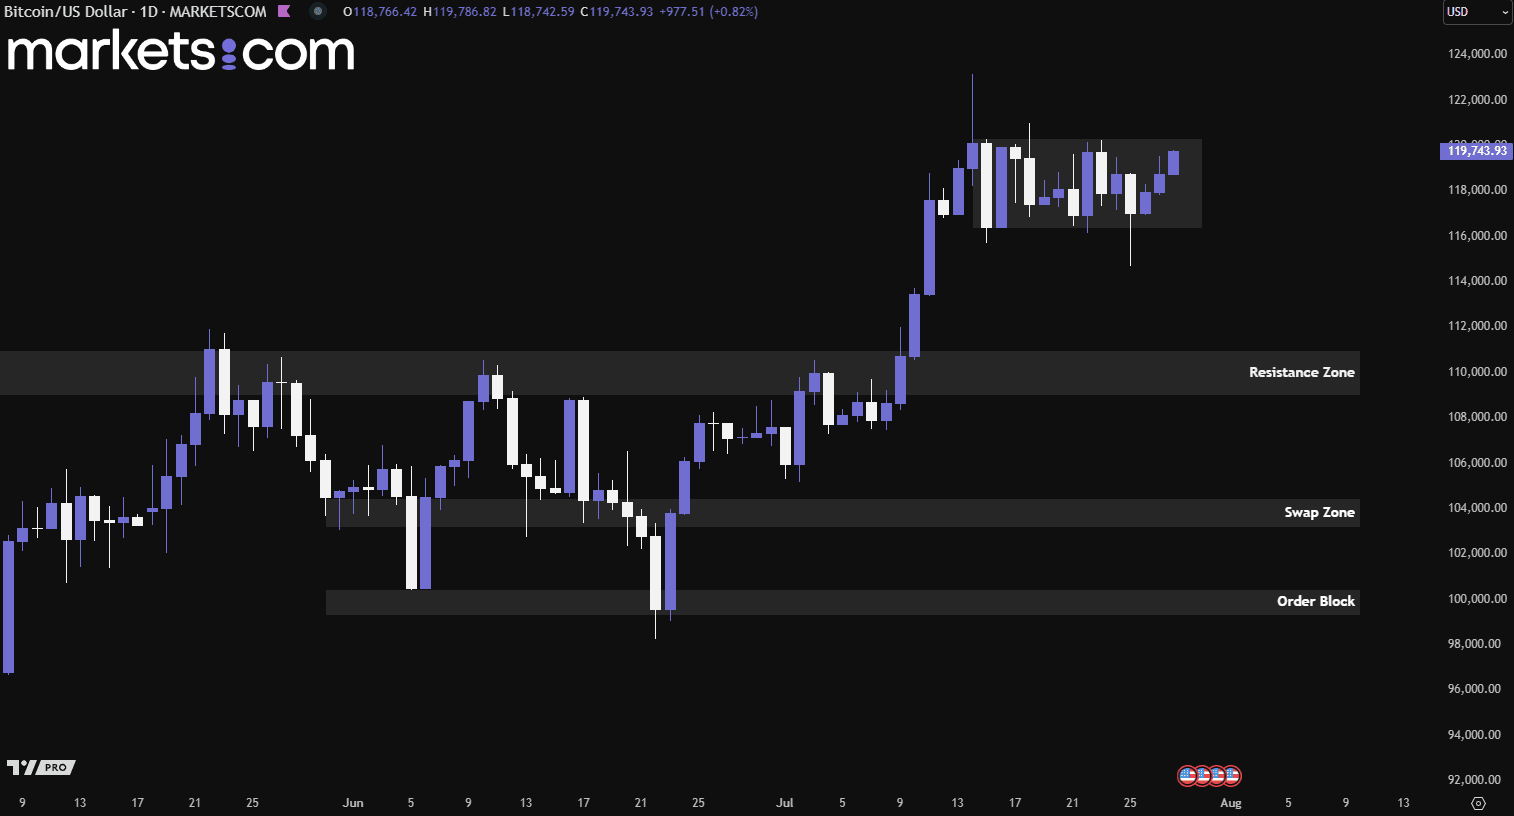
(Bitcoin Daily Price Chart, Source: Trading View)
From a technical analysis perspective, Bitcoin has been in a bullish trend since April and has been consolidating within a range of 116,300 – 120,300 since mid-July 2025. Last Friday, the price swept through the previous liquidity low, rebounded, and managed to close back within the consolidation zone. Since then, bullish momentum has continued to push the price higher, now approaching the upper boundary of the range. This valid price action may potentially lead to a breakout above the consolidation zone.
Palantir Technologies (PLTR) surged to a record high of $160 on Friday, fueled by strong investor enthusiasm and confidence in its data analytics and AI capabilities. The rally was partly driven by news that the U.S. Army awarded Palantir a $100 million, 11-month contract for a Next-Generation Command and Control prototype, part of a broader $3 billion Department of Defence request for fiscal year 2026. This underscores Palantir’s expanding footprint in national defence technology.
In the commercial space, Palantir announced a strategic partnership with Accenture Federal Services to deliver AI-powered solutions across U.S. government agencies. Separately, a collaboration with Tomorrow.io aims to integrate real-time weather data into Palantir’s platform, enhancing automated, weather-informed decision-making. With deepening government ties and broader commercial adoption, Palantir appears poised for continued growth across both federal and enterprise markets.

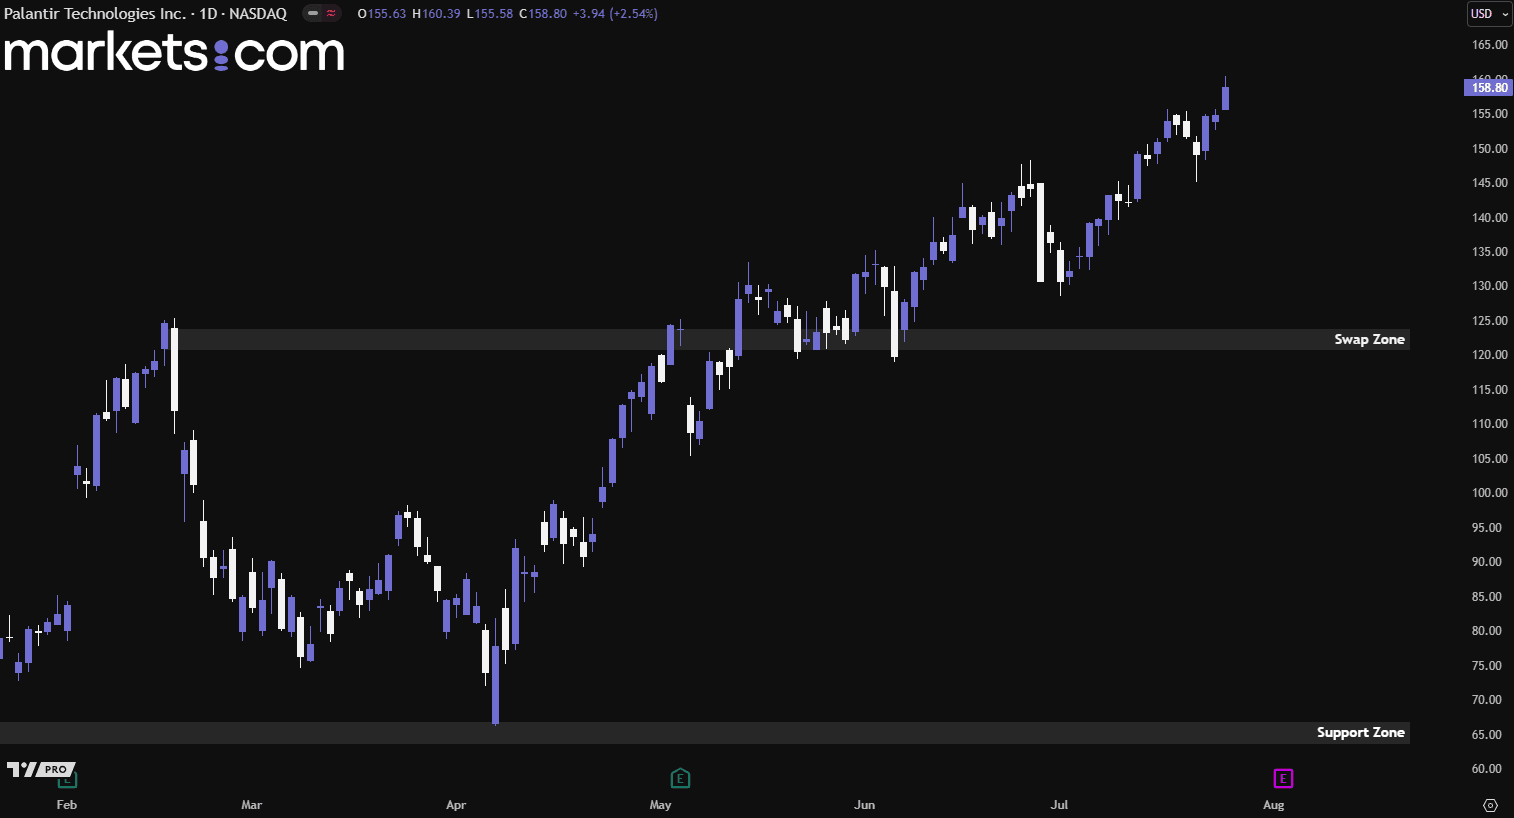
(Palantir Daily Share Price Chart, Source: Trading View)
From a technical analysis perspective, the Palantir share price has rebounded from the support zone of 64 – 67 since early April 2025. It then broke above the swap zone of 121 – 124, consolidated around that zone for a while, gained bullish momentum and continued to surge upwards. Such valid bullish momentum may continue to drive the price higher until significant bearish forces come in to indicate a reversal pattern coming in.
Risk Warning and Disclaimer: This article represents only the author’s views and is for reference only. It does not constitute investment advice or financial guidance, nor does it represent the stance of the Markets.com platform. Trading Contracts for Difference (CFDs) involves high leverage and significant risks. Before making any trading decisions, we recommend consulting a professional financial advisor to assess your financial situation and risk tolerance. Any trading decisions based on this article are at your own risk.