Jumaat Apr 4 2025 07:59

5 min.

Oil prices keep falling, mainly driven by continued pressure from the OPEC+ hike and global trade concerns. Eight key OPEC+ producers agreed to boost output by 411,000 barrels per day next month, well above the expected 140,000 and faster than planned. This comes against a backdrop of broader market turmoil sparked by higher-than-expected US tariffs announced Wednesday, which prompted countermeasures from major economies. While energy imports remain unaffected, fears of a global trade war could slow economic growth and reduce fuel demand.

(Cure Oil Futures Daily Chart, Source: Trading View)
From a technical analysis perspective, the recent price action for crude oil futures is currently retesting the support zone of 66.20 – 66.50. This is a key support level that has been tested multiple times in the past. If it finds support and rebounds from this zone, it may potentially surge upwards and retest the swap zone at 70.00 – 70.50. Conversely, a solid break below this support zone will lead to a further decline in price.
The U.S. Non-Farm Payrolls (NFP) report showed 151K job gains in February, but March is expected to see a lower 100K, indicating a slowdown in hiring. Meanwhile, the unemployment rate, which stood at 4.1% in February, is projected to tick up to 4.2% in March. This shift suggests a cooling labour market, likely influenced by economic headwinds such as higher interest rates, corporate layoffs, and cautious business sentiment. The expected slowdown in job growth and slight rise in unemployment could also reflect the lagging effects of the Federal Reserve’s monetary tightening, as companies adjust hiring plans in response to economic uncertainties. This data is set to be released on 4 April at 12:30 GMT.

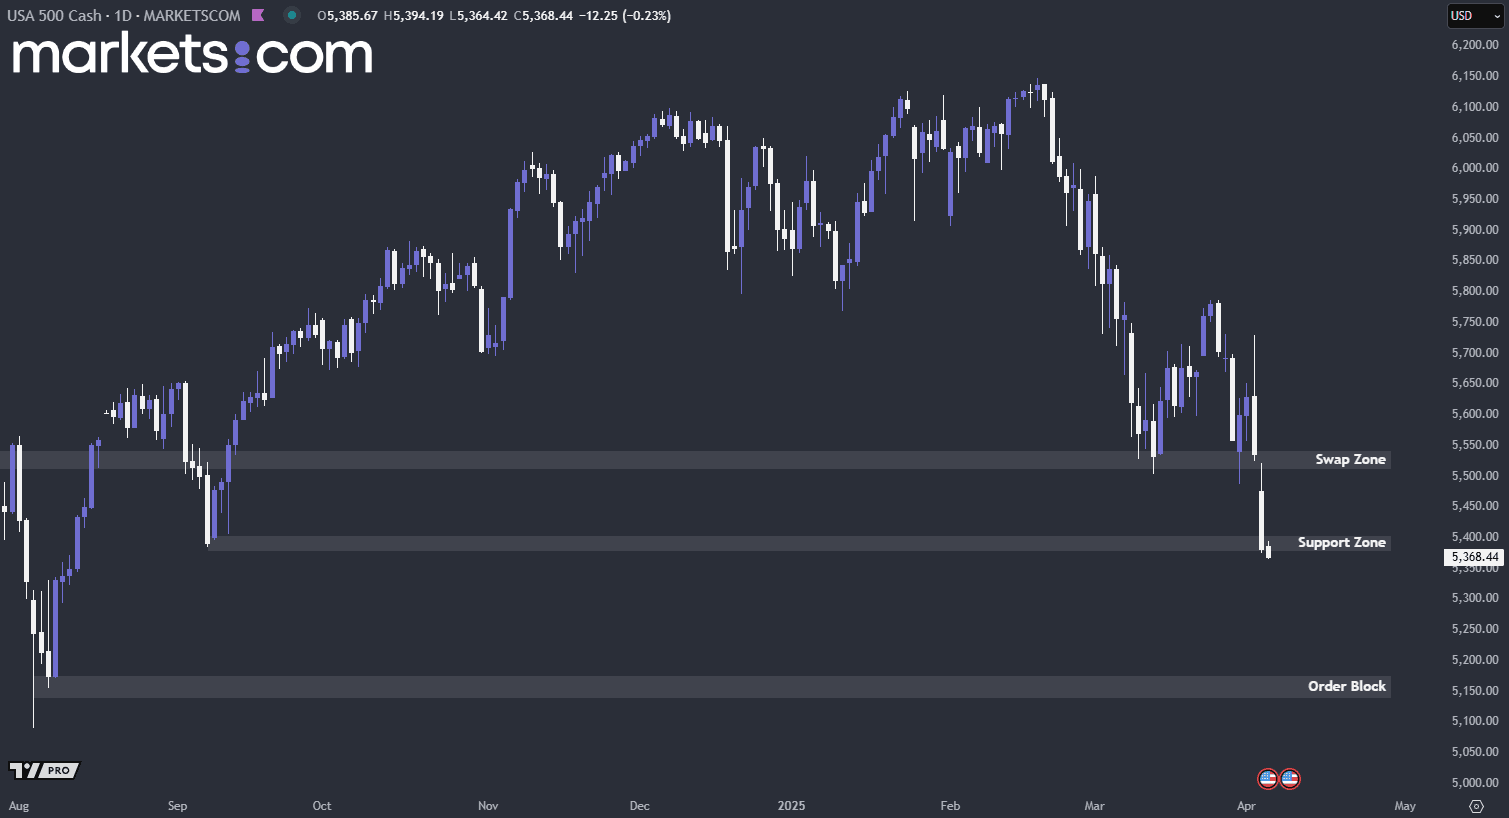
(S&P 500 Index Daily Chart, Source: Trading View)
From a technical analysis perspective, the S&P 500 index has been moving in a bearish trend since mid-February 2025, as indicated by the lower highs and lower lows. Currently, it is retesting the key support zone of 5,370 – 5,440. If it can rebound and close above this support zone, it may surge upwards to retest the swap zone of 5,510 – 5,540. Conversely, a solid break below this support zone will lead the index to form another bearish wave, potentially continuing to decline and retesting the order block of 5,140 – 5,170.
Canada’s employment change saw minimal growth in February at 1.1K, but it is expected to rise significantly to 25K in March, indicating a rebound in hiring activity. However, despite stronger job creation, the unemployment rate is projected to increase from 6.6% to 6.7%, likely due to increased labour force participation as more individuals enter the job market.
This shift suggests that while hiring is improving, the supply of workers is also growing, preventing a decline in unemployment. Factors such as seasonal trends, delayed hiring decisions, and broader economic adjustments may explain the expected rise in employment, while structural job market shifts and sector-specific weaknesses could be keeping the unemployment rate slightly elevated. These data are set to be released on 4 April at 12:30 GMT.

(USD/CAD Daily Chart, Source: Trading View)
From a technical analysis perspective, the USD/CAD currency pair has broken below the key support zone of 1.4140 – 1.4170 with significant bearish momentum. However, it may retest the broken support zone before continuing its decline. If it fails to close above that support zone, the valid bearish structure may lead it to continue declining to retest the order block at 1.3910 – 1.3950.
When considering shares, indices, forex (foreign exchange) and commodities for trading and price predictions, remember that trading CFDs involves a significant degree of risk and could result in capital loss.
Past performance is not indicative of any future results. This information is provided for informative purposes only and should not be construed to be investment advice.