Rabu Aug 13 2025 06:02

5 min

Gold prices hovered near $3,350 per ounce on Wednesday as investors assessed the Federal Reserve’s policy outlook following softer U.S. inflation data. July’s headline CPI rose 2.7%, below the 2.8% forecast, while core inflation edged up to 3.1% from 2.9%. The figures eased concerns over tariff-driven price pressures and strengthened expectations for a 25 bps Fed rate cut in September, supporting demand for non-yielding bullion. Focus now shifts to the upcoming PPI, weekly jobless claims, and retail sales data.
Market attention also remains on trade developments, with uncertainty over the tariff status of gold imports. President Trump said Monday there would be no levy, yet last week, U.S. Customs classified certain gold bars under a tariff code, surprising markets. The U.S. also extended its tariff truce with China by 90 days, while investors await the outcome of U.S.–Russia talks aimed at resolving the Ukraine conflict.

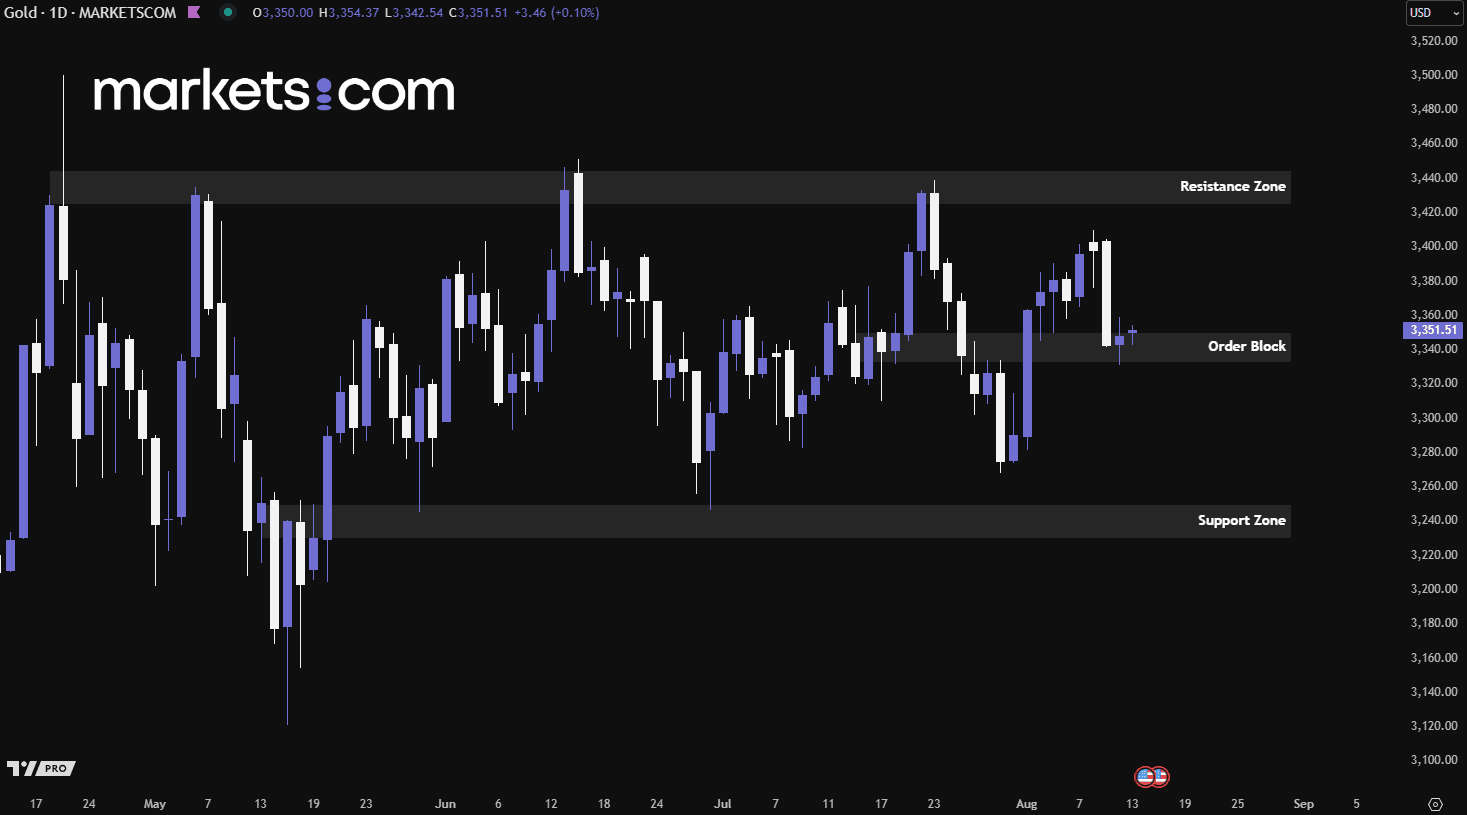
(Gold Daily Price Chart, Source: Trading View)
From a technical analysis perspective, gold has been consolidating since late May 2025, unable to break either its resistance or support zones. Recently, the price surged with strong bullish momentum, breaking above the order block at 3,333 – 3,350. However, bearish pressure pushed it back down, and it is now retesting this zone. If the level holds as support, gold could potentially climb again to retest the 3,425 – 3,445 resistance area. Conversely, a break below this zone could drive prices lower.
The U.S. dollar weakened on Wednesday after a subdued reading on July inflation reinforced expectations of a Federal Reserve rate cut next month. Data released Tuesday showed consumer prices rising only marginally, matching forecasts, with limited impact so far from President Donald Trump’s tariffs on goods. The softer inflation data fueled market confidence in an imminent policy easing, with traders pricing in a 98% chance of a rate cut, pressuring the greenback further.
Investor sentiment toward the dollar was also dampened by renewed political pressure on the Fed. Confidence took another hit after White House spokeswoman Karoline Leavitt said Trump was considering legal action against Fed Chair Jerome Powell over his handling of renovations at the central bank’s Washington headquarters, a move seen as undermining the Fed’s independence.

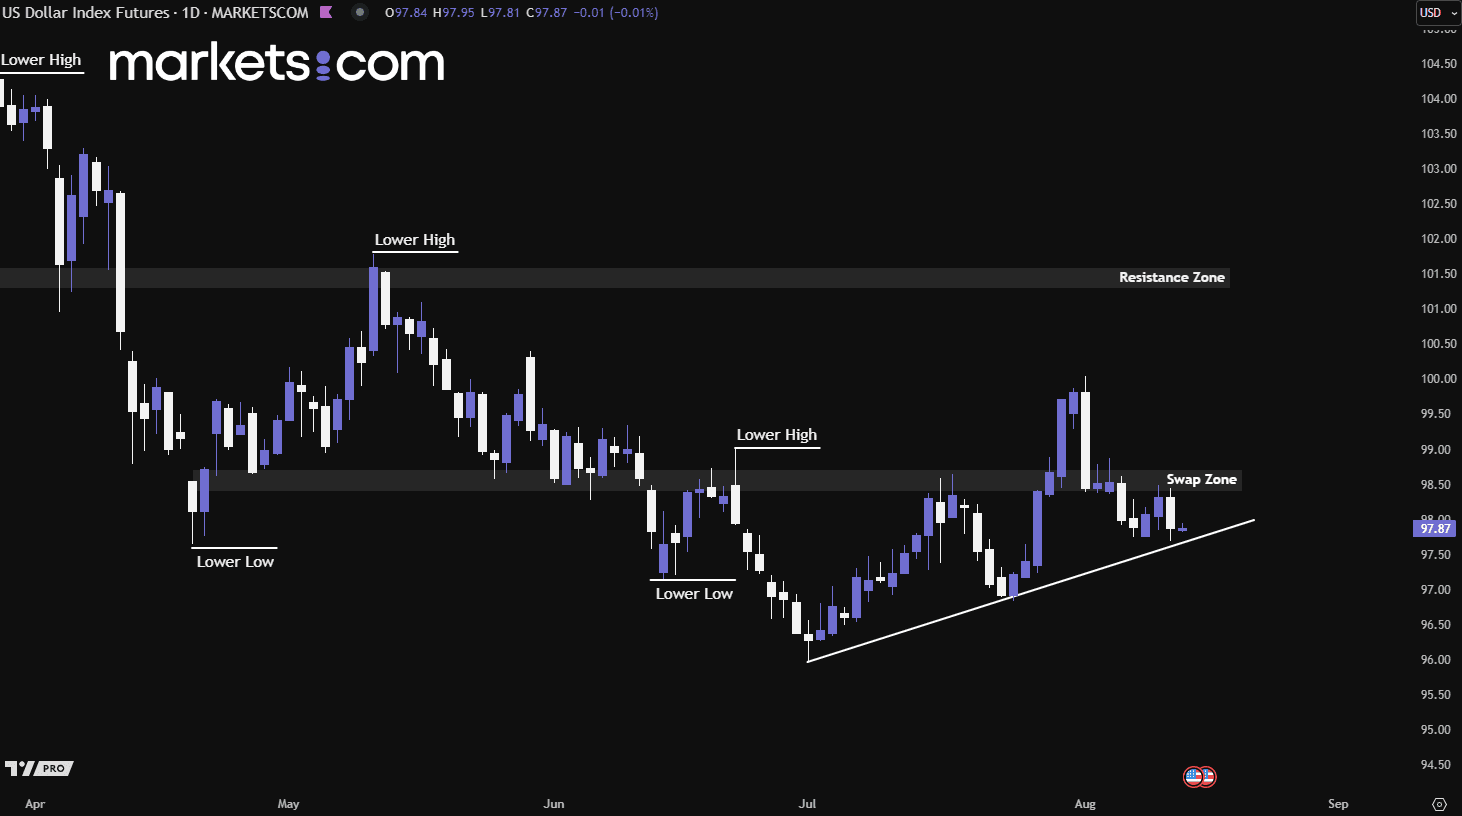
(U.S. Dollar Index Daily Chart, Source: Trading View)
From a technical analysis perspective, the U.S. dollar index has been in a bearish trend since mid-January 2025, as shown by the formation of lower highs and lower lows. However, since early July 2025, it has gained bullish momentum, forming higher highs and higher lows, and has been well supported by a bullish trend line. If the index breaks below this trend line, it could potentially resume its bearish movement and fall further. Conversely, if it holds above the trend line, the bullish momentum may continue, pushing the index higher.
WTI crude futures hovered near $63 per barrel on Wednesday, close to a two-month low, as demand concerns persisted ahead of U.S.–Russia talks. API data showed U.S. crude inventories rose by 1.52 million barrels last week, while gasoline stocks fell and distillates inched higher, indicating the summer demand peak may be fading. Geopolitical tensions also weighed on sentiment, with President Trump downplaying prospects for a breakthrough and Ukrainian President Zelensky rejecting territorial concessions.
On the supply outlook, the EIA projected U.S. crude output will peak at a record 13.4 million bpd in 2025 before declining in 2026 as lower prices slow activity. OPEC maintained its 2025 demand forecast but raised its 2026 growth estimate by 100,000 bpd to 1.38 million bpd, citing gains in other regions as U.S. output eases. Meanwhile, the U.S. Department of Energy raised its forecast for this year’s global oil surplus to 1.7 million bpd.

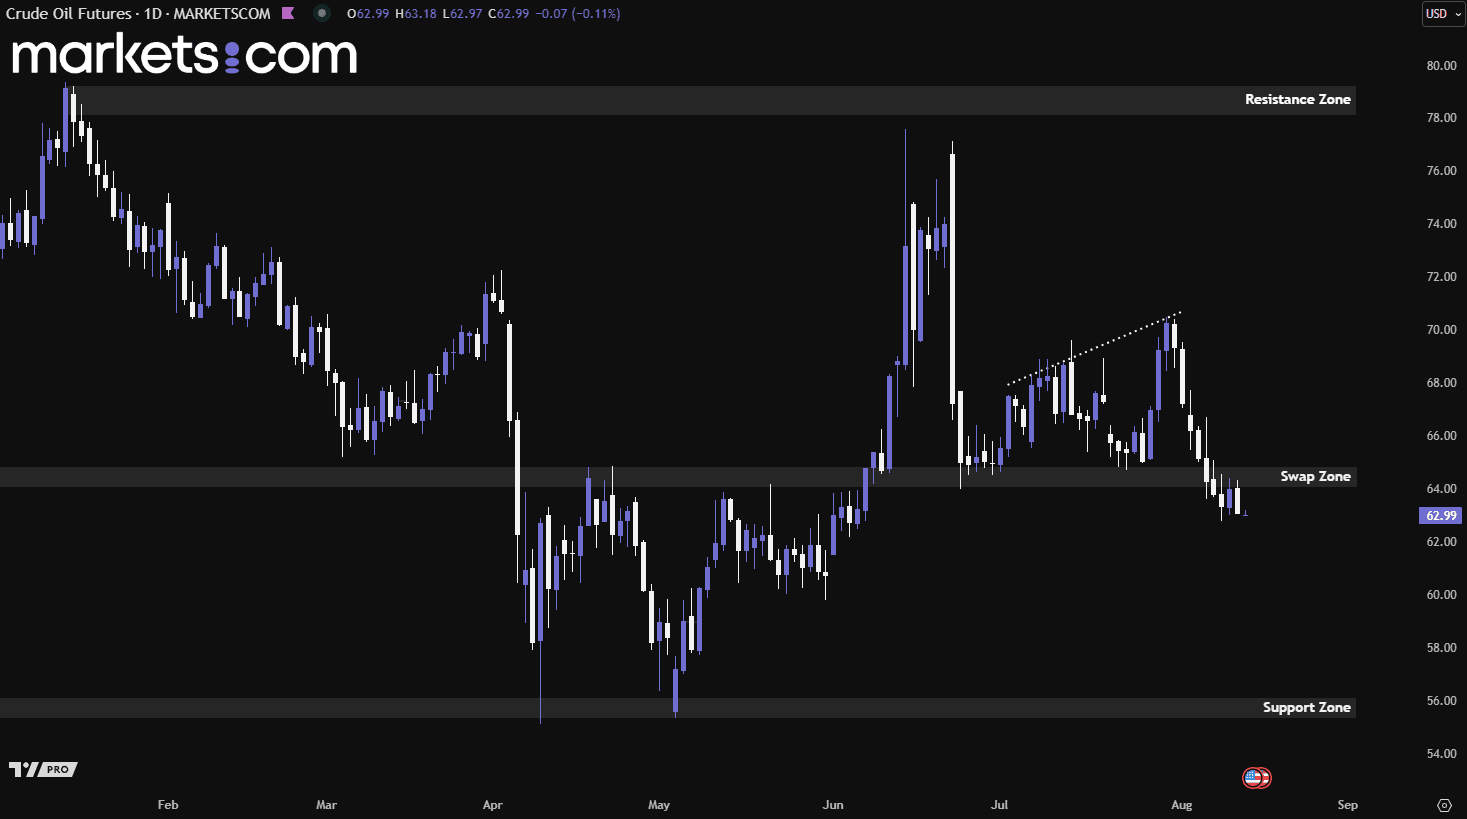
(Crude Oil Futures Daily Chart, Source: Trading View)
From a technical analysis perspective, crude oil futures recently broke below the swap zone of 64.10 – 64.80, retested it, but were rejected by bearish pressure within that zone, driving prices lower. This strong bearish momentum could potentially push the price further down, continuing its broader downtrend on the higher timeframe.
Risk Warning and Disclaimer: This article represents only the author’s views and is for reference only. It does not constitute investment advice or financial guidance, nor does it represent the stance of the Markets.com platform. Trading Contracts for Difference (CFDs) involves high leverage and significant risks. Before making any trading decisions, we recommend consulting a professional financial advisor to assess your financial situation and risk tolerance. Any trading decisions based on this article are at your own risk.