You are attempting to access a website operated by an entity not regulated in the EU. Products and services on this website do not comply with EU laws or ESMA investor-protection standards.
As an EU resident, you cannot proceed to the offshore website.
Please continue on the EU-regulated website to ensure full regulatory protection.
बुधवार Jul 16 2025 07:16

5 मिनट

Since returning to the White House in January, President Donald Trump has repeatedly criticised Federal Reserve Chair Jerome Powell for not cutting interest rates, intensifying speculation that he may attempt to pressure the Fed. His renewed calls recently for Powell’s resignation have raised concerns about the erosion of central bank independence, which could trigger volatile movements in financial markets. A perceived loss of Fed autonomy might lead investors to sell off Treasury bonds, driving up long-term yields relative to short-term rates.
A more dovish Fed, potentially more willing to lower interest rates, could have mixed implications. While it may temporarily support equities, it would likely weaken the U.S. dollar, increase Treasury market volatility, and push up long-term borrowing costs. Higher inflation expectations could also prompt lenders to demand greater returns, making mortgages and corporate bonds more expensive.

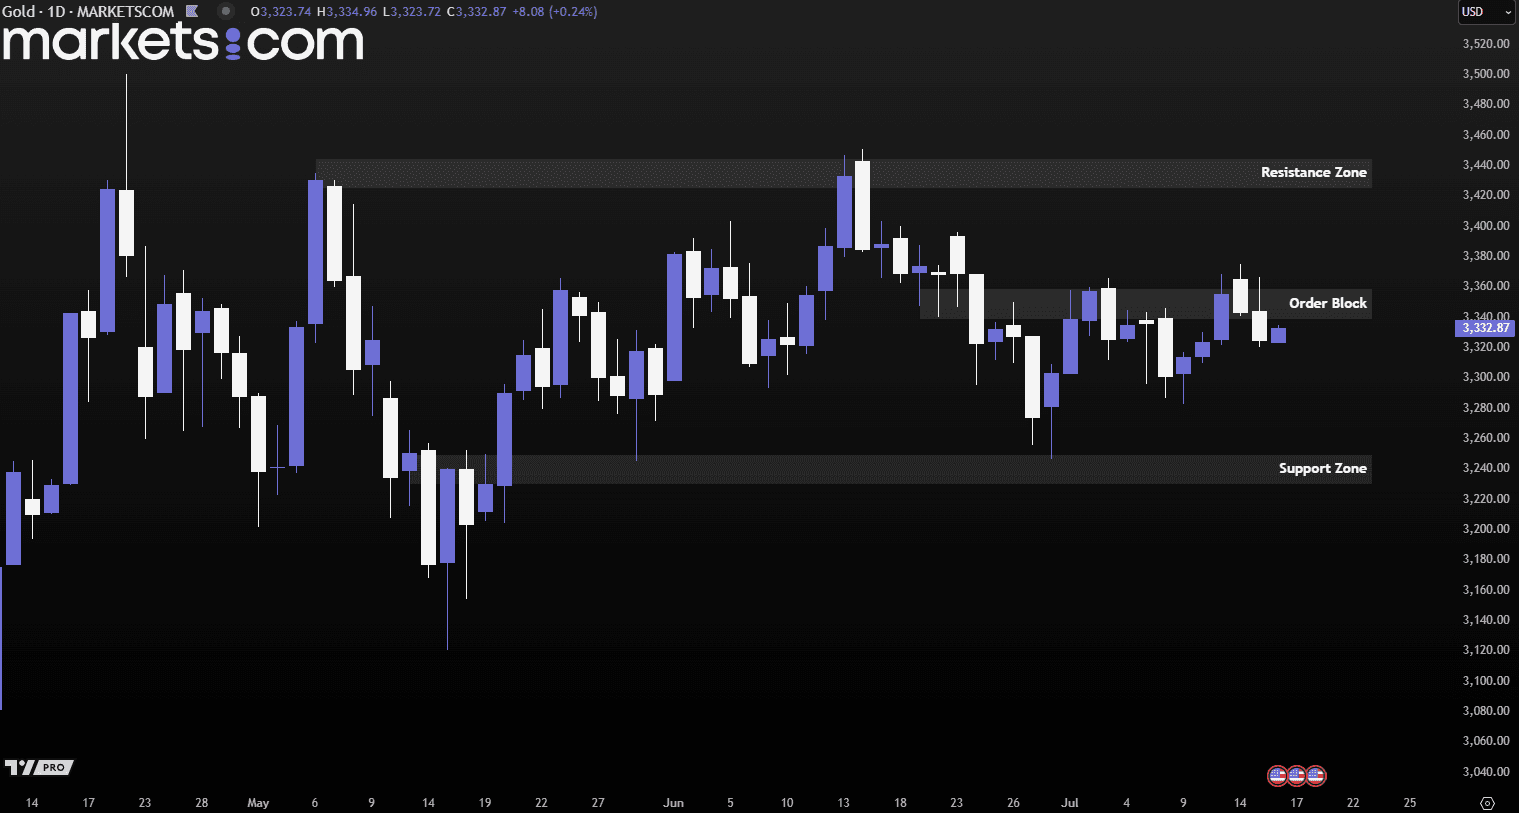
(Gold Daily Price Chart, Source: Trading View)
From a technical analysis perspective, gold prices have rebounded from the support zone of 3,230 – 3,250, as evidenced by the formation of higher highs and higher lows. Recently, the price retested the order block at 3,339 – 3,359 but failed to close above it on the daily chart. This suggests that bearish pressure remains intact and may potentially drive prices lower.
The U.S. dollar hit a 15-week high against the Japanese yen on Tuesday after the U.S. June Consumer Price Index (CPI) rose at its fastest pace in five months. The stronger-than-expected inflation data led traders to scale back their expectations for Federal Reserve rate cuts this year, now pricing in 44 basis points of easing by year-end, down slightly from 48 basis points prior to the data release. The first-rate cut is still anticipated in September.
President Donald Trump’s tariff policies are viewed as adding to inflationary pressure, potentially keeping the Fed cautious. While Fed Chair Jerome Powell has acknowledged that prices may rise through the summer, underlying inflation remains moderate.

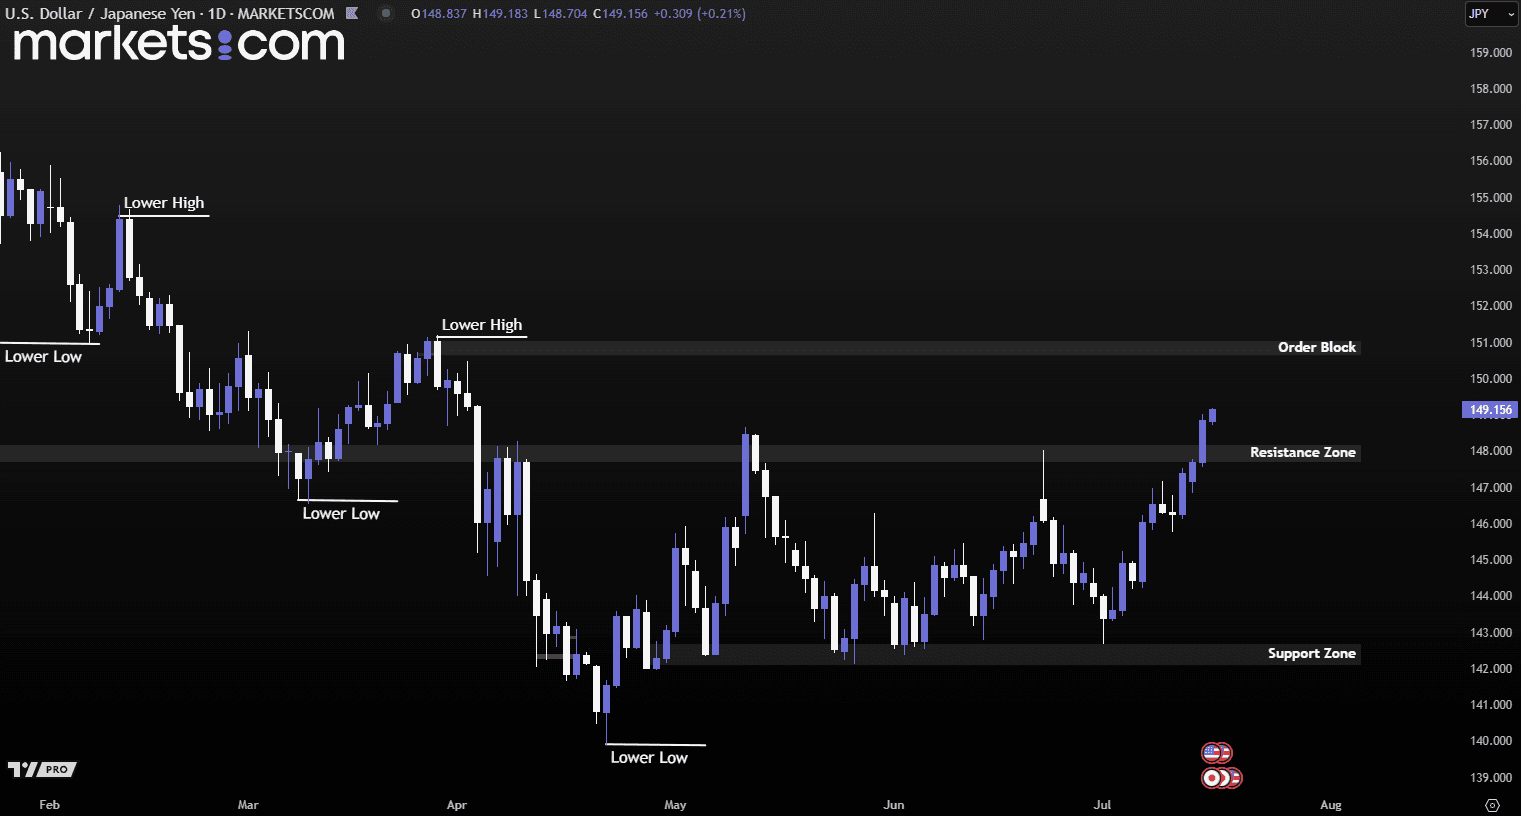
(USD/JPY Daily Chart, Source: Trading View)
From a technical analysis perspective, the USD/JPY currency pair has rebounded from the support zone of 142.10 – 142.70, as indicated by the formation of higher highs and higher lows. It has broken above the resistance zone of 147.70 – 148.20 with strong bullish momentum. This valid bullish structure may potentially continue to push the pair higher toward retesting the order block at 150.60 – 151.10.
Nvidia shares surged 4.04% on Tuesday after the company confirmed it would resume sales of its H20 AI chips to China. The decision follows assurances from the U.S. government that export licenses will be granted. This marks a major reversal from April, when sales were halted and Nvidia took a $4.5 billion charge in Q1. The H20 chips, toned-down versions of Nvidia’s more advanced processors, were designed specifically to comply with U.S. export rules targeting China.
The renewed access to China, a crucial market, is expected to significantly boost Nvidia’s revenue in the second half of 2025. CEO Jensen Huang, a vocal critic of the export curbs, previously noted the restrictions slashed Nvidia’s market share in China by nearly 50%. Alongside the H20 announcement, Nvidia also unveiled a new export-compliant chip, the RTX PRO, designed for use in smart factories and logistics. The positive momentum lifted not just Nvidia but other semiconductor stocks as well.

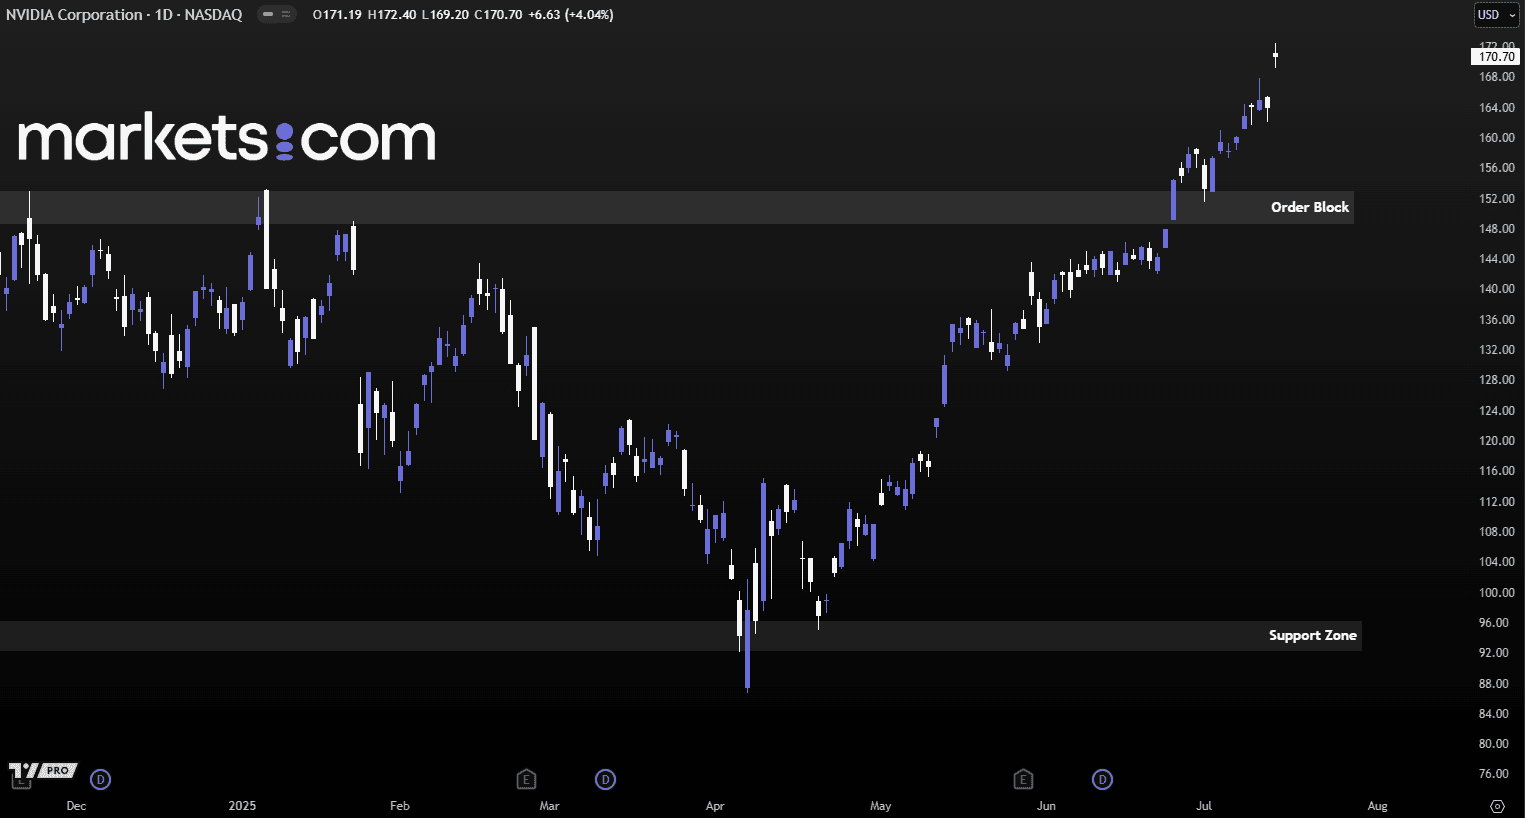
(Nvidia Daily Share Price Chart, Source: Trading View)
From a technical analysis perspective, Nvidia’s share price has been in a bullish trend since April 2025, marked by the formation of higher highs and higher lows. Recently, the price broke above the order block between 148 and 153, pulled back to retest the zone, found support, and continued to surge upward. This confirmed bullish structure may continue to drive the price higher, unless a significant bearish force emerges to reverse the trend.
Risk Warning and Disclaimer: This article represents only the author’s views and is for reference only. It does not constitute investment advice or financial guidance, nor does it represent the stance of the Markets.com platform. Trading Contracts for Difference (CFDs) involves high leverage and significant risks. Before making any trading decisions, we recommend consulting a professional financial advisor to assess your financial situation and risk tolerance. Any trading decisions based on this article are at your own risk.